
Ultra-wideband printed linearly polarized antennas (SPLA) have a huge number of topologies, as well as possible applications as part of devices or systems (radar systems, MIMO, wearable devices, modern telecommunications systems and complexes). In this paper, two printed antenna topologies are considered, which were selected after a wide scientific search: a rectangular-slit SPLA and an inverted T-shaped SPLA. For the selected antenna topologies, the main antenna parameters were obtained: frequency characteristics of the SWR, radiation patterns at a variety of frequencies from the range, the coefficient of ellipticity in the main direction of the antenna radiation. In addition, a technique for establishing the phase center of the antenna was developed and qualitative values of this parameter were obtained.
Introduction
Ultra-wideband printed linearly polarized antennas (SPLA) have a huge number of topologies, as well as possible applications as part of devices or systems (radar systems, MIMO, wearable devices, modern telecommunications systems and complexes). A characteristic feature of most of these topologies is the bi-directionality of the antenna radiation (main and reverse radiation direction). In most cases, the radiation patterns of these antennas demonstrate structural instability in the operating frequency range with variations in their overall dimensions or electrically significant areas of topology. For their use, for example, in radar, the requirement of stability of the shape and position of the main beam of the antenna is key, exactly like the position of the phase center of the antenna.
In the process of search and model studies, the following antenna topologies were considered: square-ring, rectangular-slit, inverted T-shaped, round-ring. As part of the literature review of antenna topologies, the following sources were considered in detail: [1-6].
To use an antenna as part of a device or system, the overall dimensions are often the limiting requirements for its design. In the variety of types of SPLA, those that have the minimum real dimensions, those that have the minimum effective antenna area, one-sided, or, respectively, two-sided options for implementing topologies can be distinguished. As noted above, linearly polarized printed antennas are quite sensitive to scaling their dimensions. If the use of a linear scaling law can lead to the expected results for parameters such as antenna SWR in the operating frequency band, or return losses at the antenna input (that is, by non-field characteristics), then changing the shape of the radiation pattern, the direction of the main beam, its width, along with the ellipticity coefficient may be unpredictable. In this context, modeling antennas in CAD before choosing the type of topology to manufacture is the most effective and justified approach.
Another important requirement imposed on the SPLA operating as part of some devices is its unidirectionality, that is, radiation only in a single specified direction (this direction is called the main one). Radiation in the opposite direction significantly reduces the noise immunity of the entire system (the so-called protective effect coefficient or KDD is responsible for this indicator). The only way to suppress the back radiation of the antenna is to place the reflector in the back radiation area. Naturally, the SPLA increases in size, its antenna parameters change significantly or slightly. The magnitude of the reflector's effect on antenna characteristics also depends on the chosen topology. It is obvious that the lower the negative effect of the reflector on the antenna parameters (increased SWR, return losses, etc.), the lower its positive effect (suppression of the reverse radiation of the antenna and an increase in KZD).
In this paper, two printed antenna topologies are considered, which were selected after a wide scientific search: a rectangular-slit SPLA and an inverted T-shaped SPLA. The first topology was chosen because of its wide distribution and a large amount of information on its optimization and coordination [6]. The second topology, on the contrary, was chosen because it is relatively new and promising when used as part of various devices [3].
For the selected antenna topologies, the main antenna parameters were obtained: frequency characteristics of the SWR, radiation patterns at a variety of frequencies from the range, the coefficient of ellipticity in the main direction of the antenna radiation. In addition, a technique for establishing the phase center of the antenna was developed and qualitative values of this parameter were obtained.
In this paper, we aim to show the characteristics of the studied antennas in the most complete way, for their possible use in the widest range of technical applications.
The main provisions
Figure 1 shows the geometry of the system, common to the simulation, with the specified main axes and deferred angles. The main direction of the antenna radiation will be considered the direction θ = 0º.

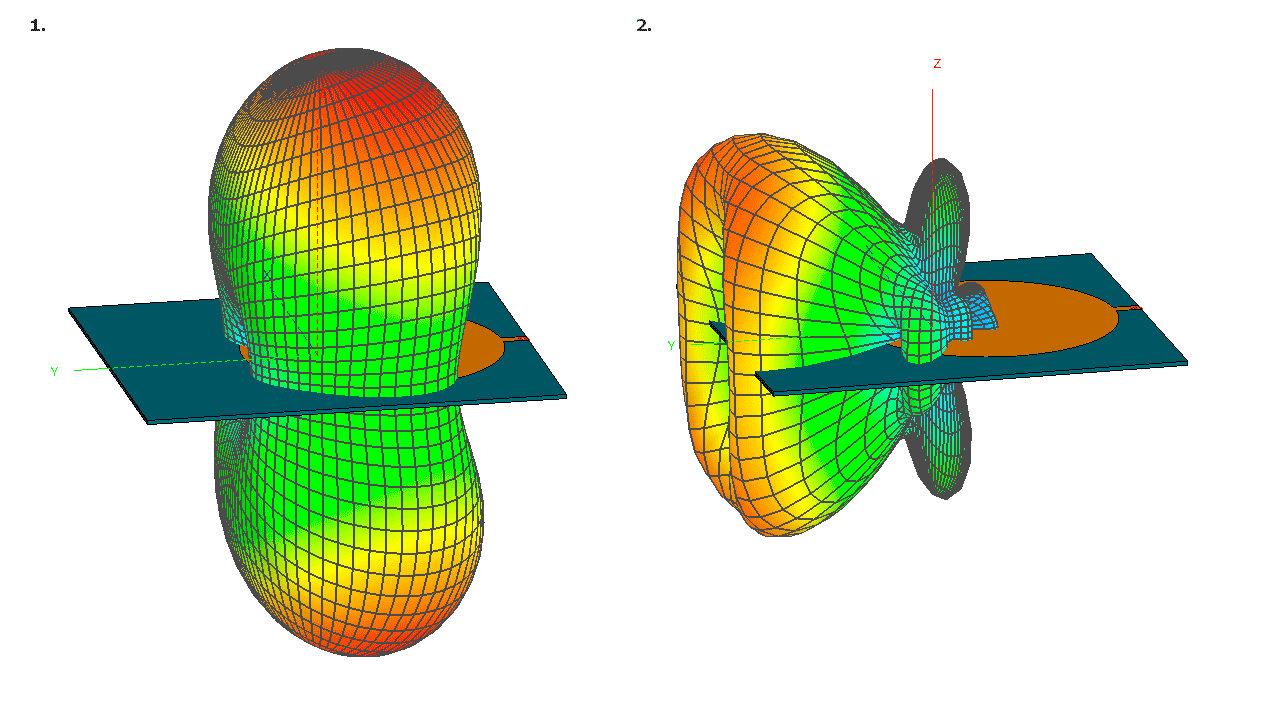
The condition of structural stability of the radiation pattern is primarily achieved by the effective size of the antenna. If the effective area of the antenna is greater than a certain value, then the radiation pattern begins to undergo significant structural changes at high frequencies. In some cases, the main lobe may rotate 90 degrees. An example of this behavior of the antenna radiation function is shown in Figure 2. It shows a model study of a round-ring SPLA. Precisely because of the sensitivity to this effect, this antenna topology was rejected for further investigation.
By the phase center, we will understand the coordinates of such a point in the reference frame associated with the antenna (Figure 1), from which the observed wave front emitted by the antenna in a given direction is spherical. This is equivalent to the fact that if you place a point emitter in the phase center of the antenna, then in a given direction the wave front emitted by the antenna and the wave front of an ideal point emitter will be identical.
The technique for determining the antenna phase center in the Altair Feko 2022 CAD is as follows:
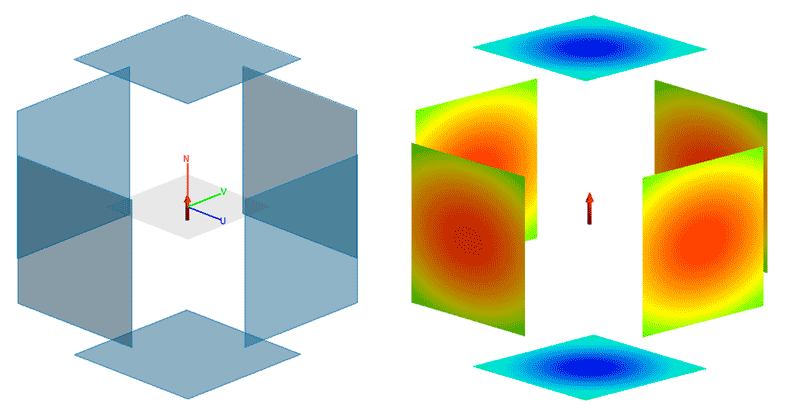
Figure 3 shows an example of determining the phase center of an ideal source, the Hertz dipole. The figure on the left shows the placement of planes with near-field radiation sensors in six axial directions, on the right shows a map of the distribution of the normalized Poynting vector across all planes of analysis.
The technique for determining the antenna phase center in the Altair Feko 2022 CAD is as follows:
- In the system connected to the antenna, near-field sensors are placed in the direction of interest, forming a plane whose normal is co-directed with the Poynting vector along the principal axis of radiation. The distance of the plane from the antenna is arbitrary, but in the far radiation zone.
- The Poynting vector is calculated on near-field sensors in a given direction.A map of the normalized distribution of a physical quantity is constructed according to the corresponding coordinates.
- In the resulting map, a segment corresponding to the distribution of a perfectly spherical wave front is selected (if possible). Next, the collocation of this segment is carried out and the geometric center of the fictitious radiator is calculated, forming a given spherical front. It should be pointed out that the spherical front on the plane is distributed according to the law:
Figure 3 shows an example of determining the phase center of an ideal source, the Hertz dipole. The figure on the left shows the placement of planes with near-field radiation sensors in six axial directions, on the right shows a map of the distribution of the normalized Poynting vector across all planes of analysis.
Antenna modeling in Altair Feko
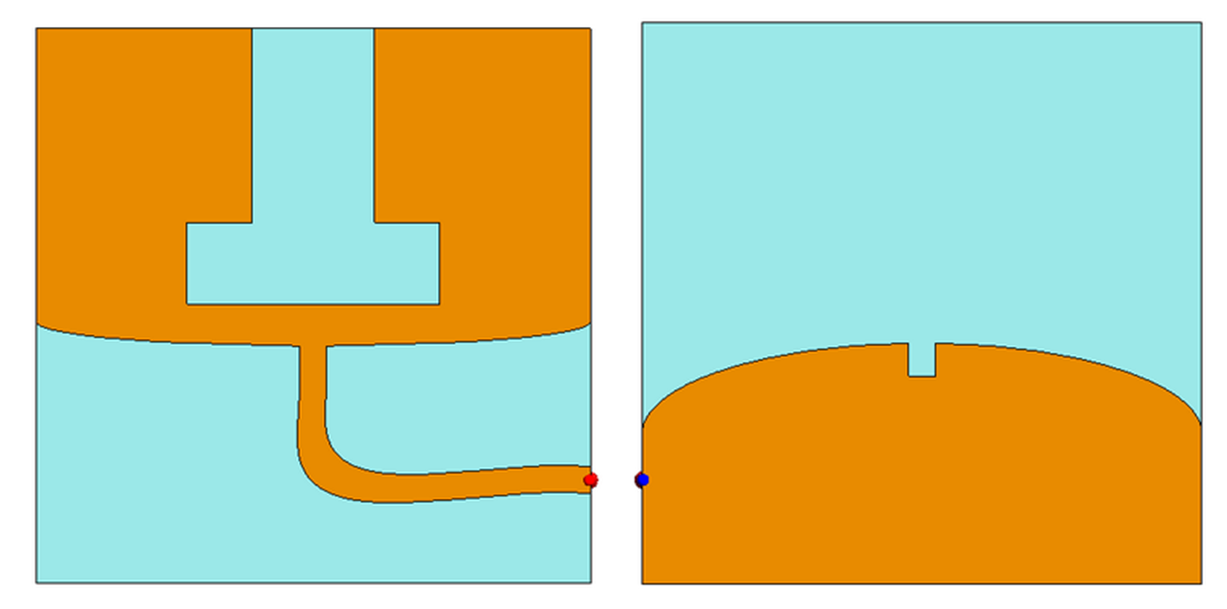
The topologies of the antennas under consideration are shown in Figures 4 and 5. The thickness of the substrate of both antenna variants is 1.56 mm. The substrate material for the antennas is Rogers RO4003C. Figure 6 shows three-dimensional directional patterns of antennas at three frequencies.
The topologies of the antennas under consideration are shown in Figures 4 and 5. The thickness of the substrate of both antenna variants is 1.56 mm. The substrate material for the antennas is Rogers RO4003C. Figure 6 shows three-dimensional directional patterns of antennas at three frequencies.
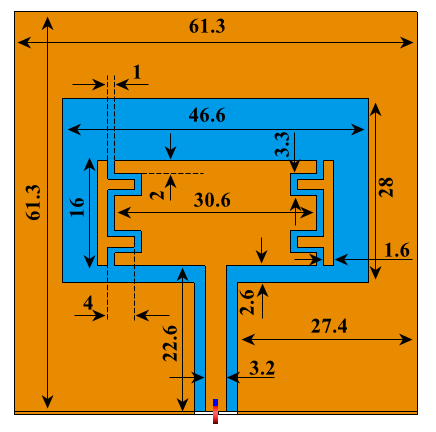
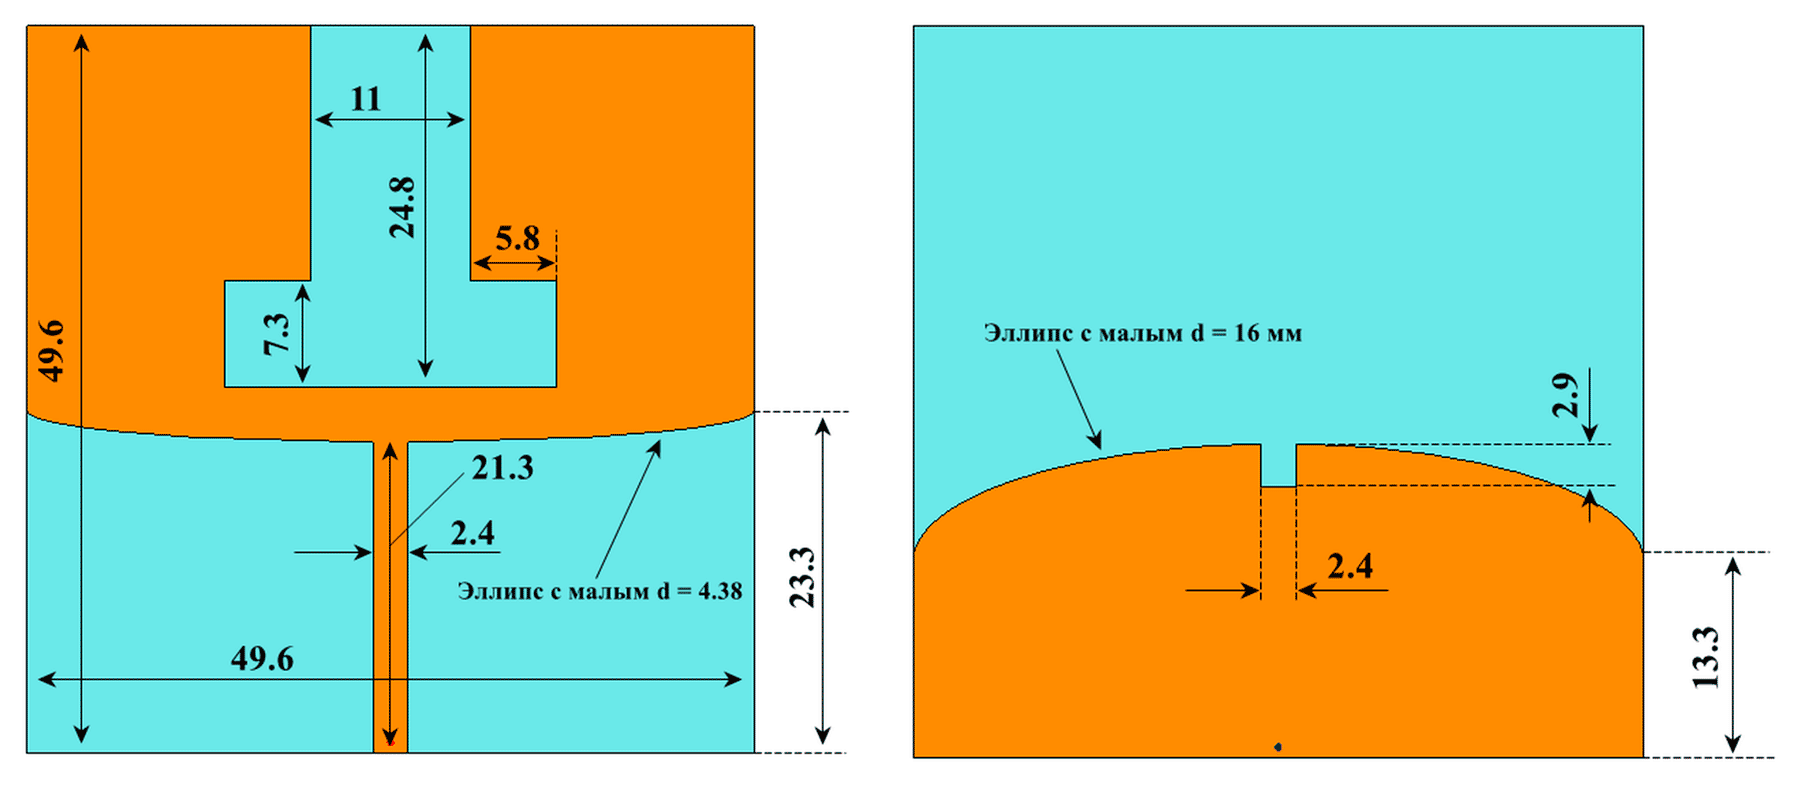
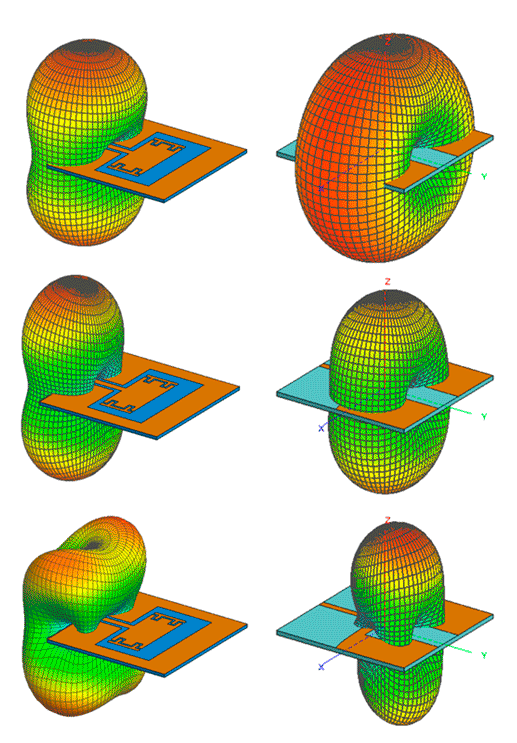
Figure 6 shows that at a high frequency, namely 4.2 GHz, the antenna pattern begins to disintegrate, and the main lobe bifurcates, thus, the stability condition of the bottom is grossly violated. Thus, if the frequency range of the antenna were determined based on the principles of structural stability of the DN, then it would be limited from above by a frequency of 4 GHz.
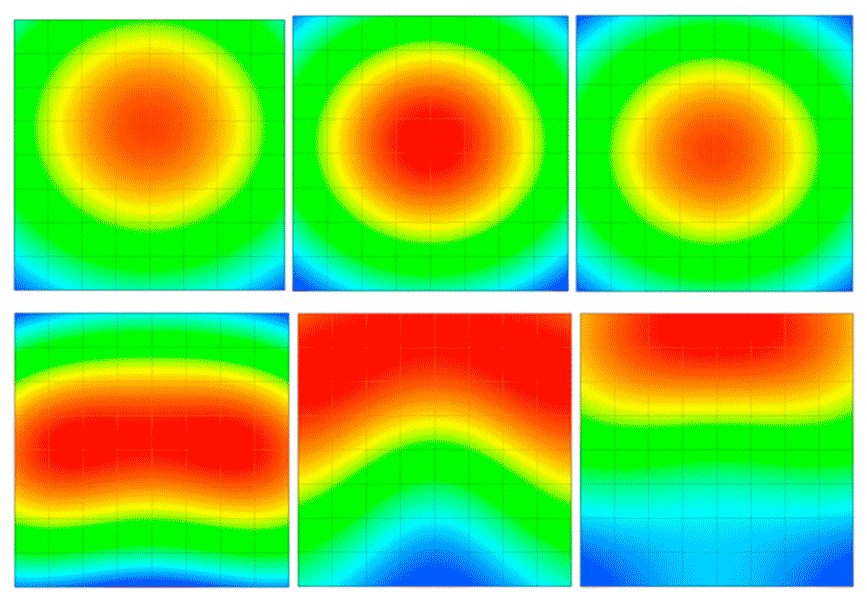
Figures 7 and 8 show characteristic maps of the distribution of the near field of the studied antennas at a distance of 0.5 m from the antenna. From the analysis of the sphericity of the distributions shown, the following conclusions can be drawn. For a rectangular-slit SPLA with matching π-shaped segments in the frequency range from 1.5 to 3.0 GHz, the phase center is located on the main axis of the antenna radiation. In the lower region of the range, the phase center is slightly offset from the main axis, by about 5 cm. Starting from a frequency of 3 GHz, it is impossible to determine the phase center of the antenna according to the above method, because The antenna radiation pattern is undergoing significant changes. It can be seen that two phase centers can be distinguished in the direction under study, diverging in opposite, orthogonal directions from the main axis of the antenna radiation.
Figures 7 and 8 show characteristic maps of the distribution of the near field of the studied antennas at a distance of 0.5 m from the antenna. From the analysis of the sphericity of the distributions shown, the following conclusions can be drawn. For a rectangular-slit SPLA with matching π-shaped segments in the frequency range from 1.5 to 3.0 GHz, the phase center is located on the main axis of the antenna radiation. In the lower region of the range, the phase center is slightly offset from the main axis, by about 5 cm. Starting from a frequency of 3 GHz, it is impossible to determine the phase center of the antenna according to the above method, because The antenna radiation pattern is undergoing significant changes. It can be seen that two phase centers can be distinguished in the direction under study, diverging in opposite, orthogonal directions from the main axis of the antenna radiation.
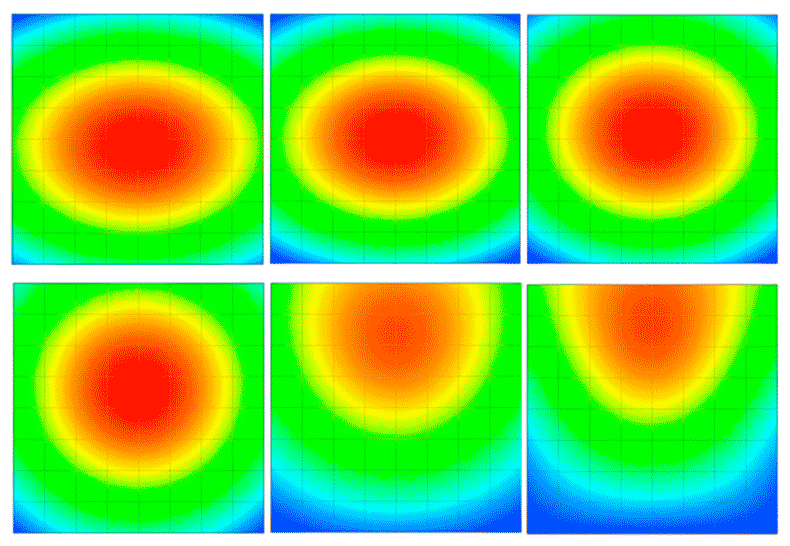
The inverted T-shaped antenna demonstrates the relative stability of the phase center with a change in frequency. At a frequency of 2.5 GHz, the phase center of the antenna is located in the vicinity of the origin of the coordinate system shown in Figure 1. With a subsequent increase in frequency, an additional phase center does not arise, but a shift of the relative main axis of the radiation is observed within 10 cm.
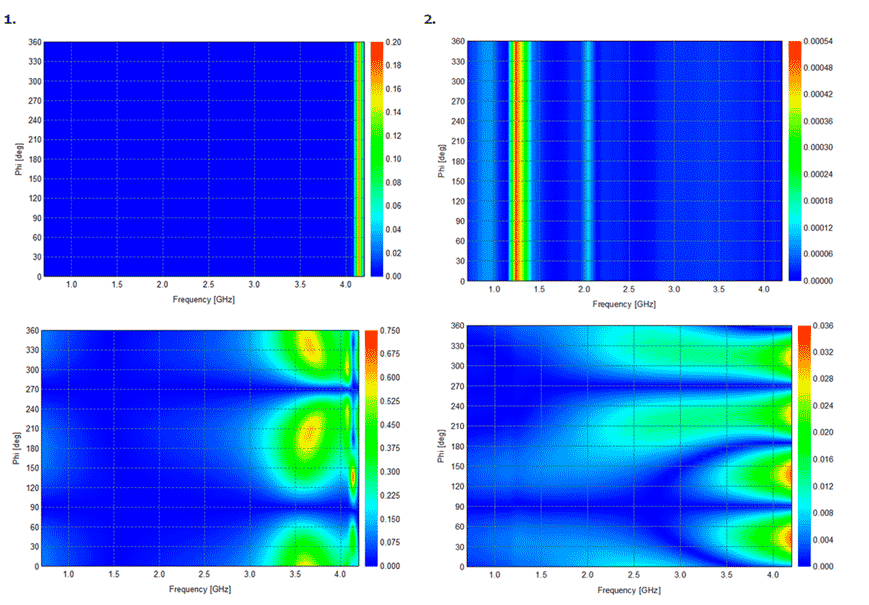
Figure 9 shows maps of the distribution of the antenna ellipticity coefficient from the horizontal angle φ and frequency.The distribution is obtained for two angles θ in the range of values of the main direction of radiation of the antennas.We can conclude that, according to the fundamental direction of radiation, the antennas are linearly polarized over a wide frequency range. The change in the direction of observation affects, first of all, the value of the coefficient in the high frequency range and only in small ranges of the angle φ.
Figure 9 shows maps of the distribution of the antenna ellipticity coefficient from the horizontal angle φ and frequency.The distribution is obtained for two angles θ in the range of values of the main direction of radiation of the antennas.We can conclude that, according to the fundamental direction of radiation, the antennas are linearly polarized over a wide frequency range. The change in the direction of observation affects, first of all, the value of the coefficient in the high frequency range and only in small ranges of the angle φ.
When forming antenna arrays or MIMO systems from the proposed antennas, it may be necessary to change the position of the antenna port. If a coplanar line is the most convenient implementation option for a rectangular-slit SPLA (at least for the topology shown in Figure 4), then an inverted T-shaped SPLA can be effectively connected to a microstrip line. If constructively necessary, the line section that determines the input impedance of the antenna can be connected to the end wall of the antenna as shown in Figure 10. Such a transformation of the antenna topology does not lead to changes in its key parameters.
Experimental study of antennas
The following measurements were carried out as part of the experimental study:
These measurements were carried out for both a free antenna and an antenna with a reflector. A conical dielectric antenna with an exciting circular waveguide was used as a measuring antenna. This antenna has a directional beam, a uniform wave front and a deep cross-polarization decoupling of the order of -29 dB. When measuring the SWR of the antennas, the Rohde & Schwarz ZVH8 vector circuit analyzer was used, calibrated according to a standard single-port circuit. The harmonic monochrome signal for the measuring antenna was produced by a Rohde & Schwarch SMU 200 vector signal generator. The measured antenna was located on a rotary antenna positioner, and the level of the received signal was set by the Anritsu S332D spectrum analyzer.
Figures 11 and 12 show photographs of the antennas under study. Both antennas without a reflector and with a reflector, which is a rectangular cutout from a substrate with a solid metallization screen, are experimentally investigated. The reflector is attached to the antenna through mounting holes, using dielectric pins.
The following measurements were carried out as part of the experimental study:
- SWR antennas in a wide frequency band;
- antenna directional pattern in the horizontal plane at one frequency from the operating range;
- the coefficient of ellipticity of the antenna through cross-polarization isolation.
These measurements were carried out for both a free antenna and an antenna with a reflector. A conical dielectric antenna with an exciting circular waveguide was used as a measuring antenna. This antenna has a directional beam, a uniform wave front and a deep cross-polarization decoupling of the order of -29 dB. When measuring the SWR of the antennas, the Rohde & Schwarz ZVH8 vector circuit analyzer was used, calibrated according to a standard single-port circuit. The harmonic monochrome signal for the measuring antenna was produced by a Rohde & Schwarch SMU 200 vector signal generator. The measured antenna was located on a rotary antenna positioner, and the level of the received signal was set by the Anritsu S332D spectrum analyzer.
Figures 11 and 12 show photographs of the antennas under study. Both antennas without a reflector and with a reflector, which is a rectangular cutout from a substrate with a solid metallization screen, are experimentally investigated. The reflector is attached to the antenna through mounting holes, using dielectric pins.
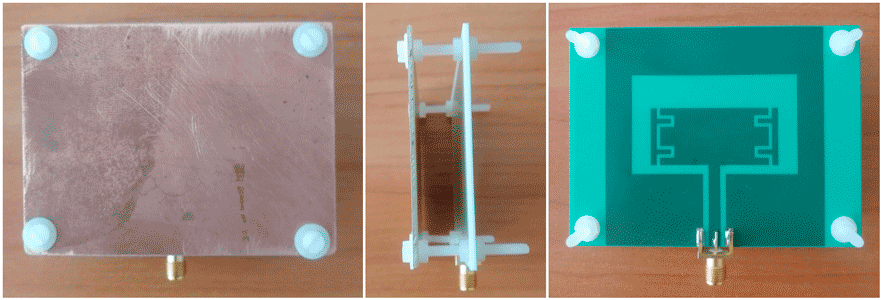
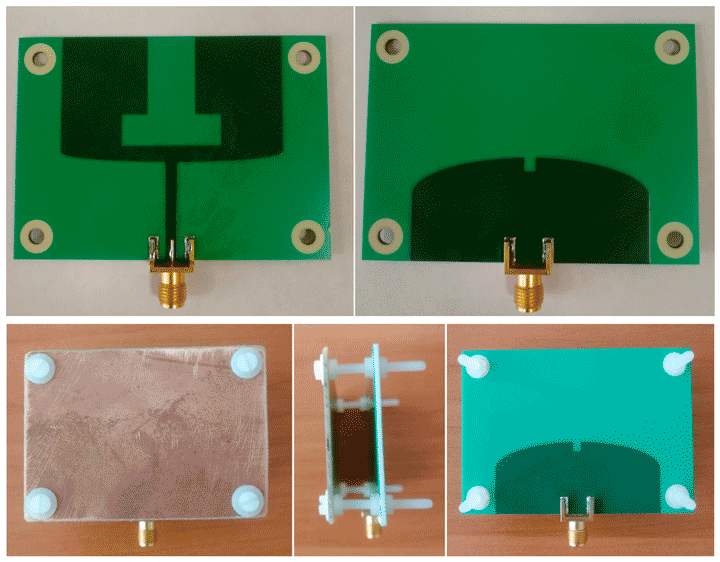
Figure 13 shows a comparison of the measured frequency characteristics of SWR antennas up to 8 GHz. Figure 14 shows a comparison of the simulation data with the experimental results. In the operating band of the antenna radiation, the data coincide with a good degree of accuracy.
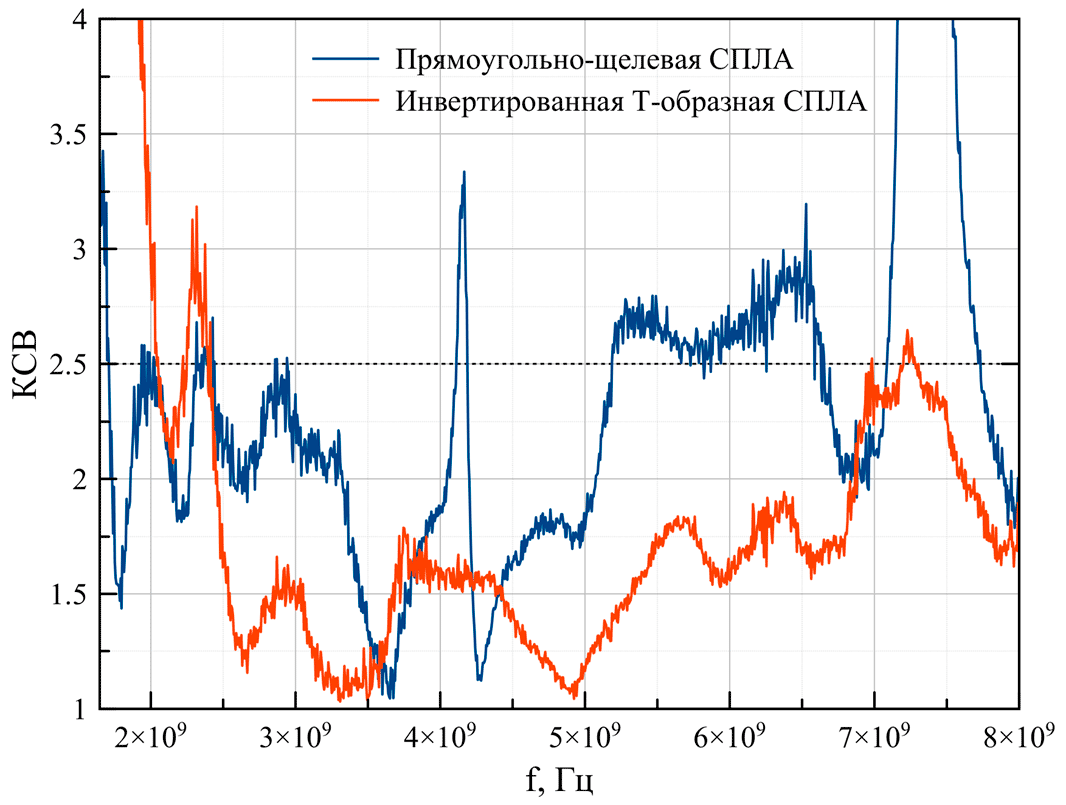
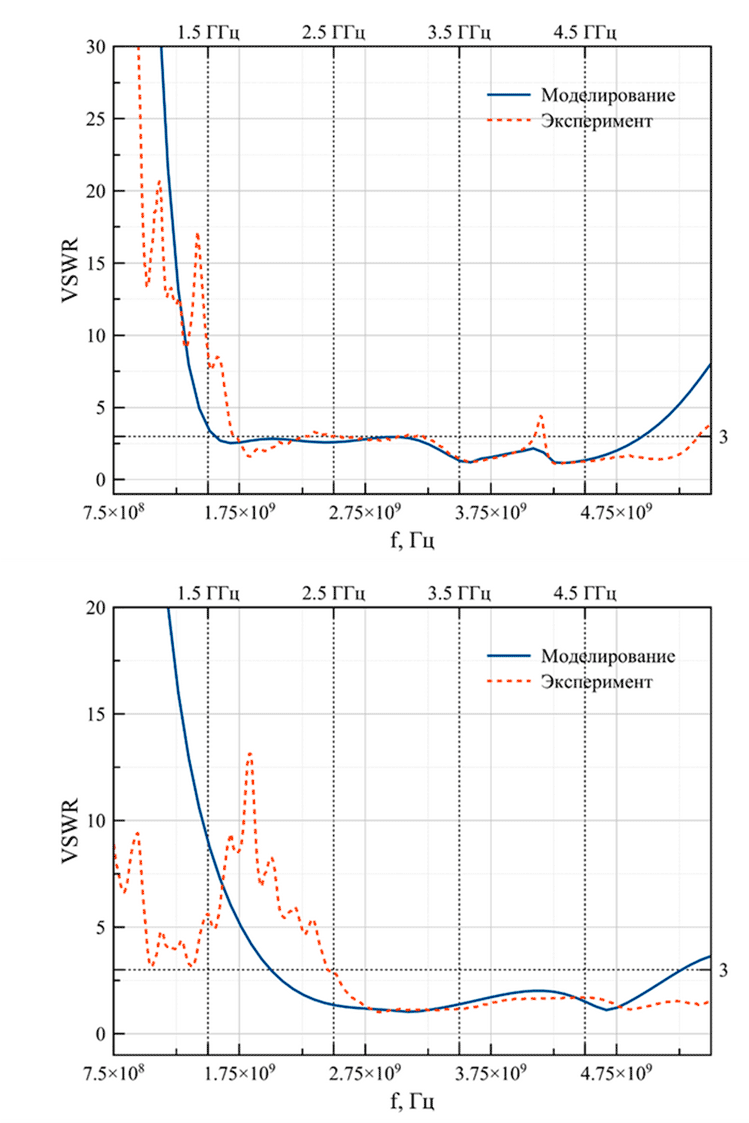
Figure 15 shows the results of an experiment on the effect of the reflector on the SWR of antennas, at different distances of the reflecting plane from the antenna H. It is easy to see that the influence of the reflector on the rectangular-slit SPLA is much higher than on the inverted T-shaped topology, and this effect is negative – SWR in the operating frequency band increases sharply. To measure the antenna bottoms, the following reflector parameters were selected: H = 20 mm, dimensions 92 x 118 mm (for a rectangular-slit SPLA) and : H = 10 mm, reflector dimensions 70 x 89 mm (for an inverted T-shaped SPLA).
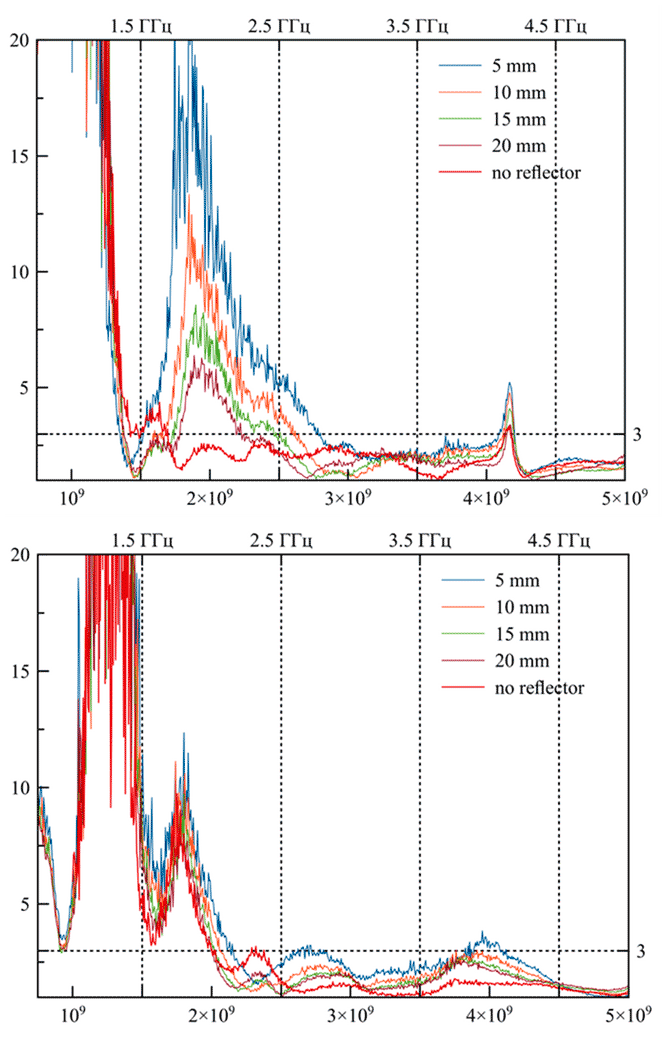
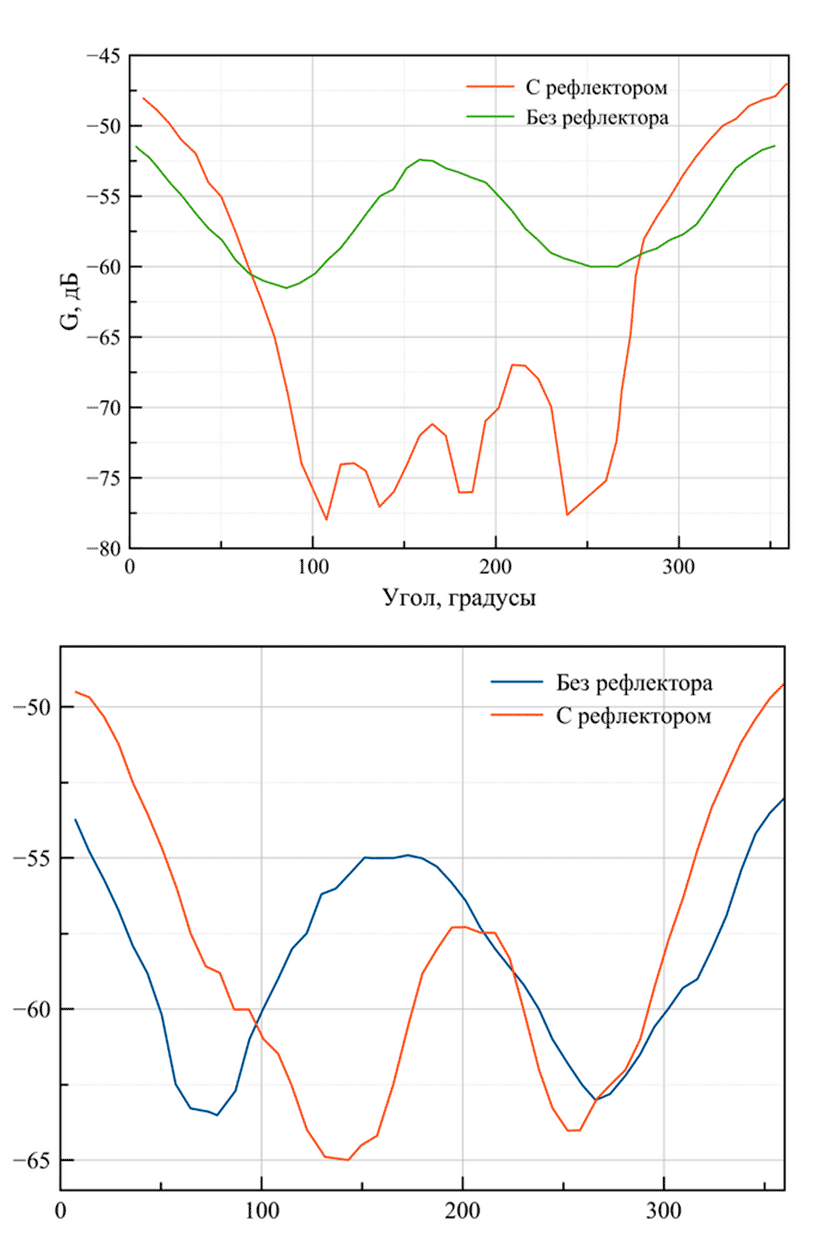
Figure 16 shows the non-normalized experimental DN for all studied antennas. A comparison of the measurement results with the simulation results (Figure 6) showed a high degree of coincidence of characteristics. Antenna bottom measurements were carried out according to the method described above at a single frequency equal to 2.95 GHz. As expected, the positive effect of the reflector on the rectangular-slit SPLA turned out to be much higher than on the inverted T-shaped SPLA, the KZD of this antenna topology turns out to be higher than the alternative variant under study (29 dB vs. 10 dB).
Measured values of the ellipticity coefficient through cross-polarization isolation in the principal direction (the measuring antenna rotates 90° at an azimuth position of 0°) for antennas without a reflector: rectangular-slit SPLA -18.7 dB (0.0135) and inverted T-shaped SPLA – 20 dB (0.01).
Three important conclusions can be drawn from the comparison shown in Figure 16. For a rectangular-slit splice:
The ellipticity coefficient became equal to -10.3 dB. This means that the reflector has reduced the ellipticity coefficient of the antenna by 8.4 dB.
For an inverted T-shaped SPLA:
The ellipticity coefficient became equal to -13.5 dB. This means that the reflector has reduced the ellipticity coefficient of the antenna by 6.5 dB.
The maximum level of side lobes for a rectangular-slit SPLA was -20 dB versus -8 dB for an inverted T-shaped SPLA. The width of the main lobe at the -3dB level was 58 degrees for a rectangular-slit SPLA versus 63 degrees for an inverted T-shaped SPLA. These parameters are given for antennas with reflectors.
Results and conclusions
This article discusses in detail two topologies of ultra-wideband printed antennas. The numerical simulation developed by representatives of SAPR Altair Feko company may become an experienced researcher. The considered antennas are supposed to be used as part of devices for a wide variety of purposes, which is why antenna topologies have been studied, each of which has both its advantages and disadvantages. Below we present the main conclusions on the criteria for comparing two antennas.
Licensing, acceptance, acquisition of Altair Feko:
For training, granting temporary licenses for Altair Feko software solutions, testing and purchase, please contact the specialists of NanoTechProm LLP by phone +7 (777) 797-89-75 or by e-mail info@nanotechprom.kz
List of literature
1. P.N. Choubi, W. Hong, Z.-S. Hao, P. Chen, T.-V. Duong, J. Mei, Broadband dual-mode antenna with triangular ring connector (TCSRS) supported by two resonators, IEEE Proceedings on Antennas and their Propagation, vol. 64, No. 6, pp. 2541-2545, 2016.
2. M.Sumi, Y. Suzuki, Broadband single-sided dipole antenna with off-center power supply for 4G/5G/Wi-Fi M2M/IoT applications and unmanned aerial vehicles, IEEE Conference on Antenna Measurements and Applications (CAMA), pp. 3-4, 2021.
3. M.-S.Tan, H. Wang, T. Deng, R.V. Tsiolkovsky, Compact flat ultra-wideband antennas with continuously adjustable independent bandpass filters, IEEE Transactions on antennas and propagation, vol. 64, No. 8, pp. 3292-3301, 2016.
4. M.-S.Tan, T. Shi, R.V. Tsiolkovsky, Flat ultra-wideband antennas with improved real gain characteristics, IEEE Transactions on Antennas and Propagation, vol. 64, No. 1, pp. 61-69, 2016.
5. S.-S.Chen, Yu.-S. Tsou, Integration of small-sized two-band monopole LTE/WWAN exciter antennas with metal covers, IEEE transactions on antennas and distribution, vol. 64, No. 8, pp. 3707-3711, 2016.
6. U.Kuatavikun, P. Jarapraditkul, N. Ananthrasichai, O. Sangarun, T. Wakabayashi, Broadband slit antenna powered by CPW with tuning plug and pi band for use in WLAN/WiMAX networks, International Symposium on Intelligent Signal Processing and Communication Systems (ISPACS), 2008.
Three important conclusions can be drawn from the comparison shown in Figure 16. For a rectangular-slit splice:
- the antenna gain in the main direction increased due to the use of a reflector by 3.75 dB;
- the minimum suppression of back radiation by the reflector is about 10 dB, the maximum suppression is 23 dB;
- the influence of the reflector on the width of the main lobe is insignificant.
The ellipticity coefficient became equal to -10.3 dB. This means that the reflector has reduced the ellipticity coefficient of the antenna by 8.4 dB.
For an inverted T-shaped SPLA:
- the antenna gain in the main direction increased due to the use of a reflector by 4.2 dB;
- the minimum suppression of back radiation by a reflector is 0 dB, the maximum suppression is 8.6 dB;
- the influence of the reflector on the width of the main lobe is insignificant (the beam expands).
The ellipticity coefficient became equal to -13.5 dB. This means that the reflector has reduced the ellipticity coefficient of the antenna by 6.5 dB.
The maximum level of side lobes for a rectangular-slit SPLA was -20 dB versus -8 dB for an inverted T-shaped SPLA. The width of the main lobe at the -3dB level was 58 degrees for a rectangular-slit SPLA versus 63 degrees for an inverted T-shaped SPLA. These parameters are given for antennas with reflectors.
Results and conclusions
This article discusses in detail two topologies of ultra-wideband printed antennas. The numerical simulation developed by representatives of SAPR Altair Feko company may become an experienced researcher. The considered antennas are supposed to be used as part of devices for a wide variety of purposes, which is why antenna topologies have been studied, each of which has both its advantages and disadvantages. Below we present the main conclusions on the criteria for comparing two antennas.
- The total area of the inverted T-shaped SPLA is 34.5% less than that of the rectangular-slit SPLA.
- Reflectors of equal relative sizes have a much greater effect on the parameters of a rectangular-slit SPLA than on an inverted T-shaped SPLA. These effects turn out to be both positive and negative when using the antenna as part of the device.
- The gain of the rectangular-slit SPLA is about 2.3 dB higher than that of the inverted T-shaped SPLA.
- The noise immunity of a rectangular-slit SPLA is about three times higher than that of an inverted T-shaped SPLA when using reflectors with the same relative dimensions.
- The width of the main lobe at the level of half the power of the inverted T-shaped SPLA is, on average, 5 degrees greater than that of the rectangular-slit SPLA.
- The ellipticity coefficient in the main radiation direction of the inverted T-shaped SPLA is, on average, 3 dB lower than that of the rectangular-slit SPLA.
Licensing, acceptance, acquisition of Altair Feko:
For training, granting temporary licenses for Altair Feko software solutions, testing and purchase, please contact the specialists of NanoTechProm LLP by phone +7 (777) 797-89-75 or by e-mail info@nanotechprom.kz
List of literature
1. P.N. Choubi, W. Hong, Z.-S. Hao, P. Chen, T.-V. Duong, J. Mei, Broadband dual-mode antenna with triangular ring connector (TCSRS) supported by two resonators, IEEE Proceedings on Antennas and their Propagation, vol. 64, No. 6, pp. 2541-2545, 2016.
2. M.Sumi, Y. Suzuki, Broadband single-sided dipole antenna with off-center power supply for 4G/5G/Wi-Fi M2M/IoT applications and unmanned aerial vehicles, IEEE Conference on Antenna Measurements and Applications (CAMA), pp. 3-4, 2021.
3. M.-S.Tan, H. Wang, T. Deng, R.V. Tsiolkovsky, Compact flat ultra-wideband antennas with continuously adjustable independent bandpass filters, IEEE Transactions on antennas and propagation, vol. 64, No. 8, pp. 3292-3301, 2016.
4. M.-S.Tan, T. Shi, R.V. Tsiolkovsky, Flat ultra-wideband antennas with improved real gain characteristics, IEEE Transactions on Antennas and Propagation, vol. 64, No. 1, pp. 61-69, 2016.
5. S.-S.Chen, Yu.-S. Tsou, Integration of small-sized two-band monopole LTE/WWAN exciter antennas with metal covers, IEEE transactions on antennas and distribution, vol. 64, No. 8, pp. 3707-3711, 2016.
6. U.Kuatavikun, P. Jarapraditkul, N. Ananthrasichai, O. Sangarun, T. Wakabayashi, Broadband slit antenna powered by CPW with tuning plug and pi band for use in WLAN/WiMAX networks, International Symposium on Intelligent Signal Processing and Communication Systems (ISPACS), 2008.